
Find an individual call
Open Monitoring → Live Feed (#feed). Rows show recorded tool calls, including their tool, router, risk, duration and result. Open a row to inspect its recorded request, response and error.
Use the search field for a call ID, tool, input or error, and combine it with tool, risk, device and status filters. The row count distinguishes displayed, matching and buffered calls.
For a call outside the live buffer, paste its complete ID into Find a recorded call and choose Inspect call. This queries saved history. The same ID can be given to the assistant through get_tool_call.
Work with the feed
- Pause / Resume controls the live presentation while you inspect.
- Clear filters to restore the unfiltered view.
- Export CSV or JSON: selected matching rows when selected, otherwise all matching buffered rows.
- Select rows and explicitly confirm deletion to remove their saved activity records.
- Change the rendered row limit in Config → Dashboard preferences.
Recorded details are secret-redacted and may be truncated. A missing call may still be in flight, have expired under retention, have been deleted, or never have been saved. A saved tool response describes that execution; it does not guarantee the router's current state.
See observability storage and transport.
Screen preview
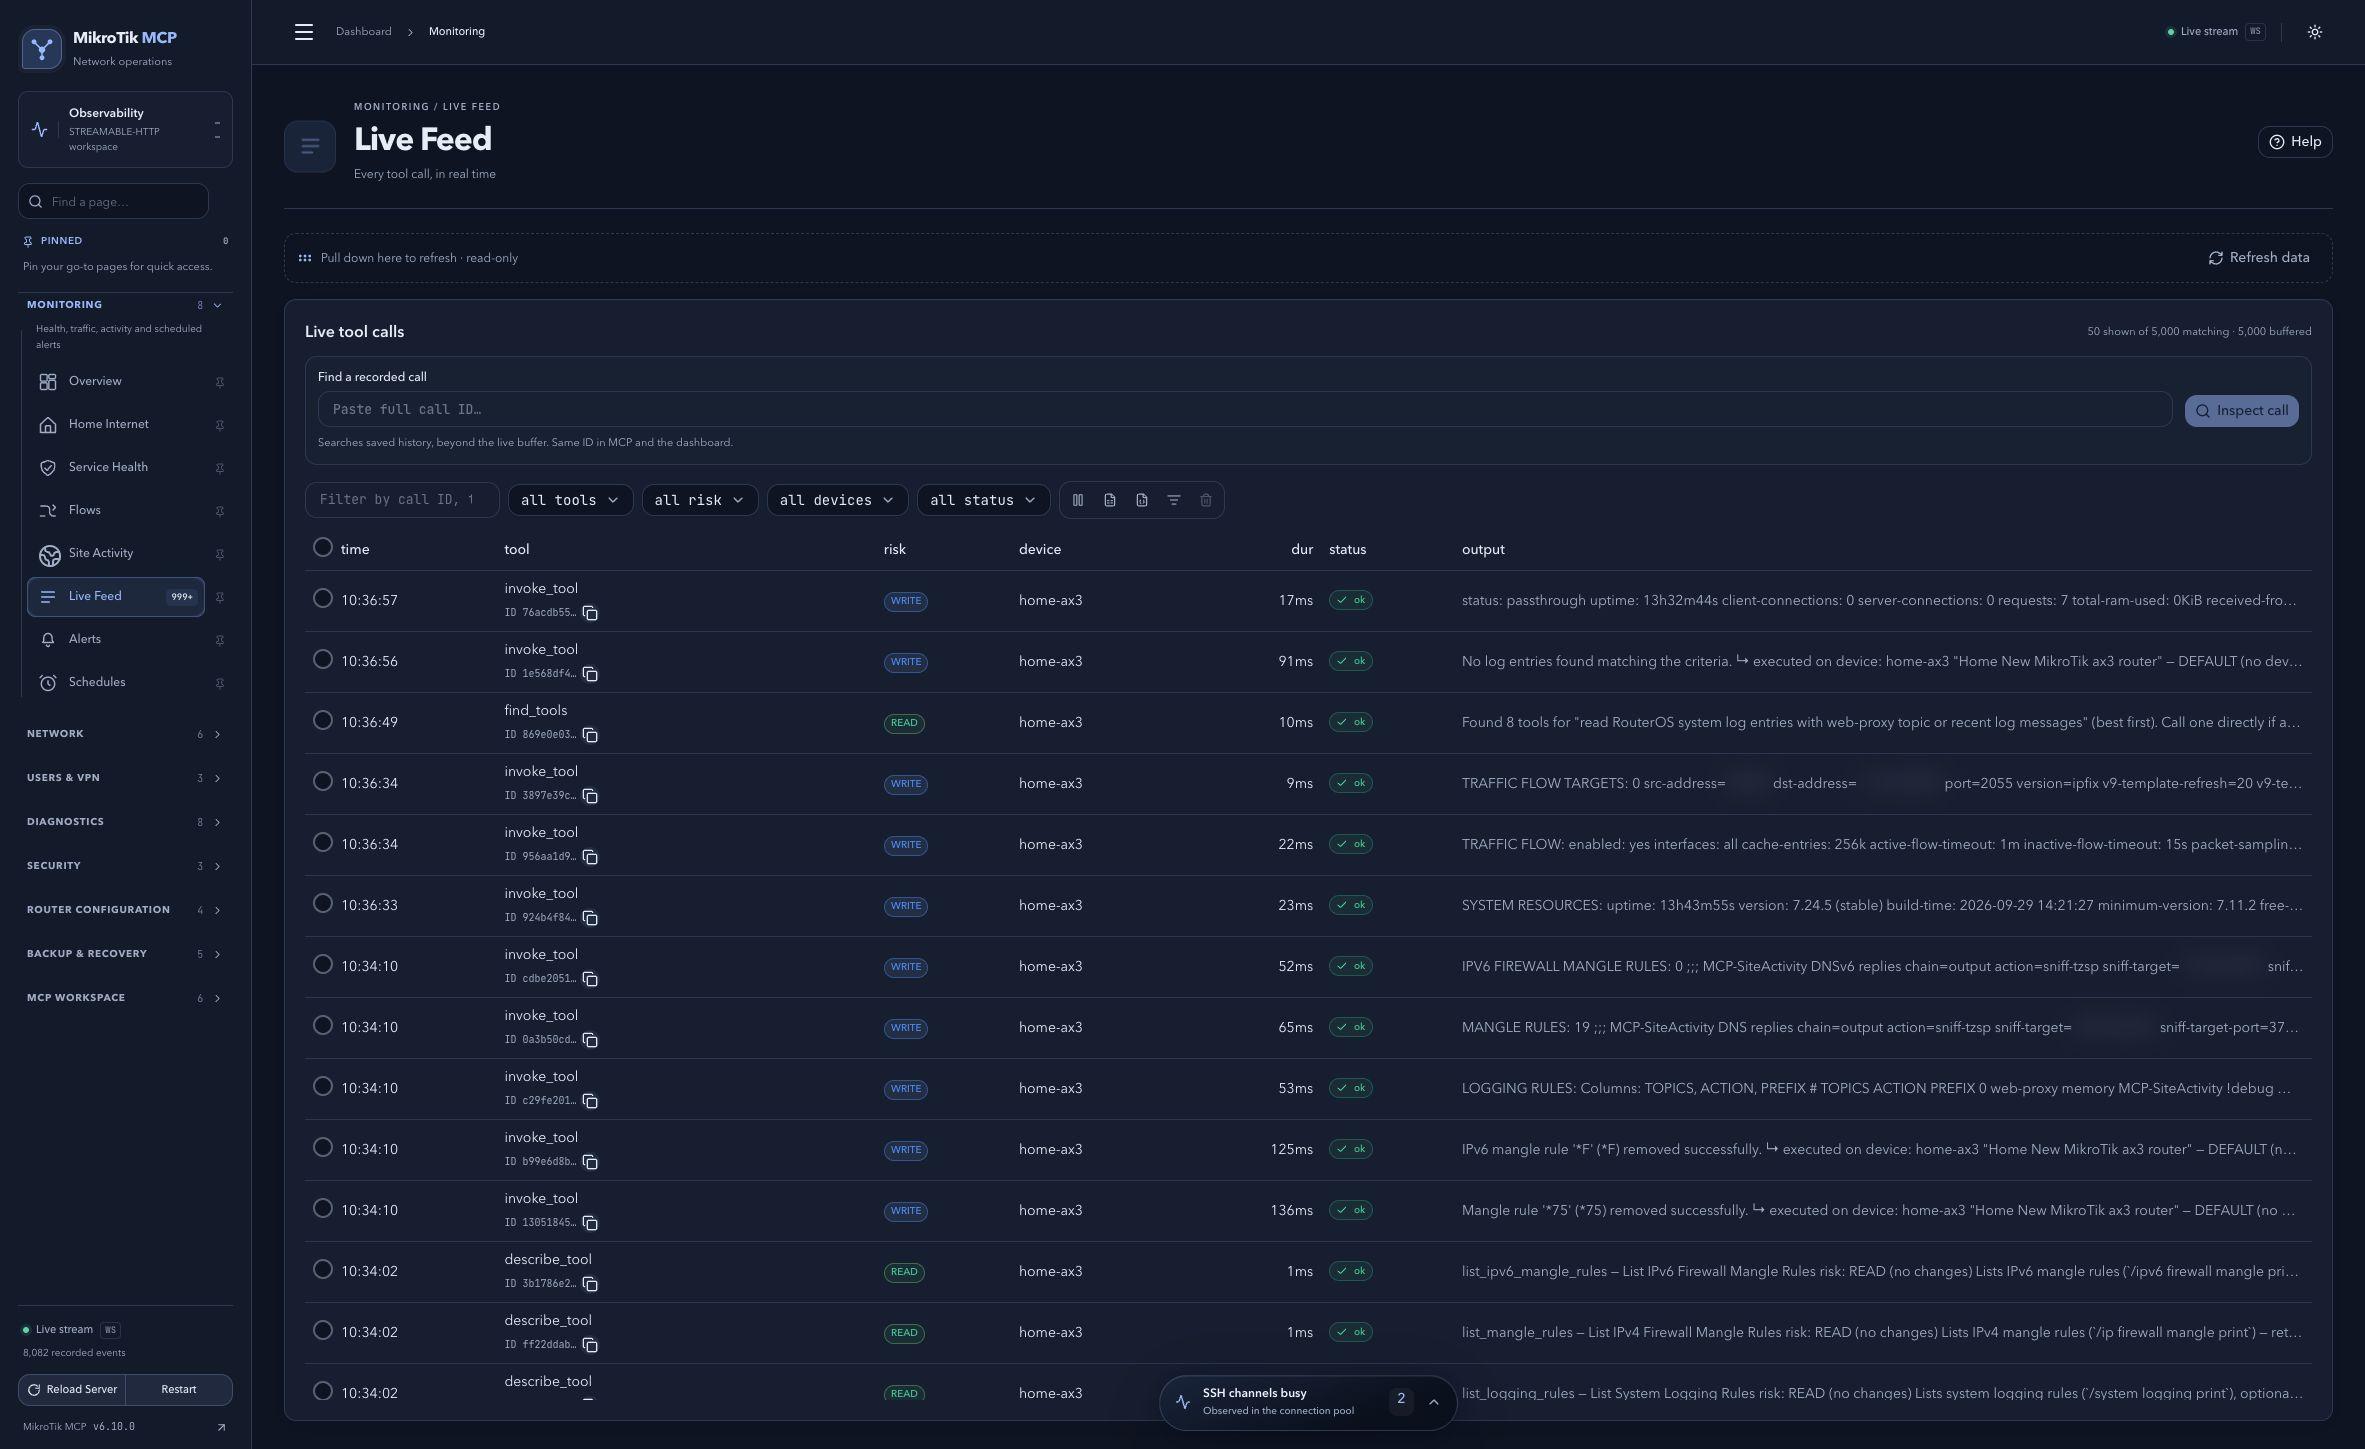 Full-page dashboard preview with IP addresses and snapshot/backup names blurredFull page · Click to enlarge ↗
IP addresses, snapshot/backup names and AAA/OpenVPN usernames are blurred in this full-page capture.