
Collect a client-focused case
Open Diagnostics → Investigations (#investigations).
- Select the access router.
- Choose a known client or enter its IPv4/MAC.
- Enter a destination hostname or IPv4 and a service label.
- Optionally select up to two additional router perspectives.
- Choose Create investigation.
Selecting a router or client does not start probes. Creation reads sources sequentially and sends three router-originated ICMP probes per router. It does not change router configuration or probe from the client itself.
Read the saved result
The case contains capture time, evidence-source counts, unavailable sources, a configuration journey, tunnel inventory and an evidence explorer grouped by router. Saved cases are snapshots, not live telemetry.
A router ping does not prove the client's VPN, route or application works. A running interface is not a verified handshake. Tunnel animation is decorative; Pause motion only changes that presentation. Inspect missing/truncated evidence and the suggested next experiments before drawing a conclusion.
Check an exported flow
The Flow evidence desk can look up one actual IPv4 TCP/UDP tuple from an existing Traffic Flow collector. Choose Find recent flows or enter destination, protocol and both ports manually, then Check exported path.
Forward and reverse evidence are separate. Optional interface-name resolution is limited to eight selected names. Nothing enables flow exports automatically; missing exports do not prove drops. Read the exact flow evidence workflow and limitations.
Use Client Check for measurements from the affected device, and Support Bundles to prepare a minimized report from saved evidence.
Screen preview
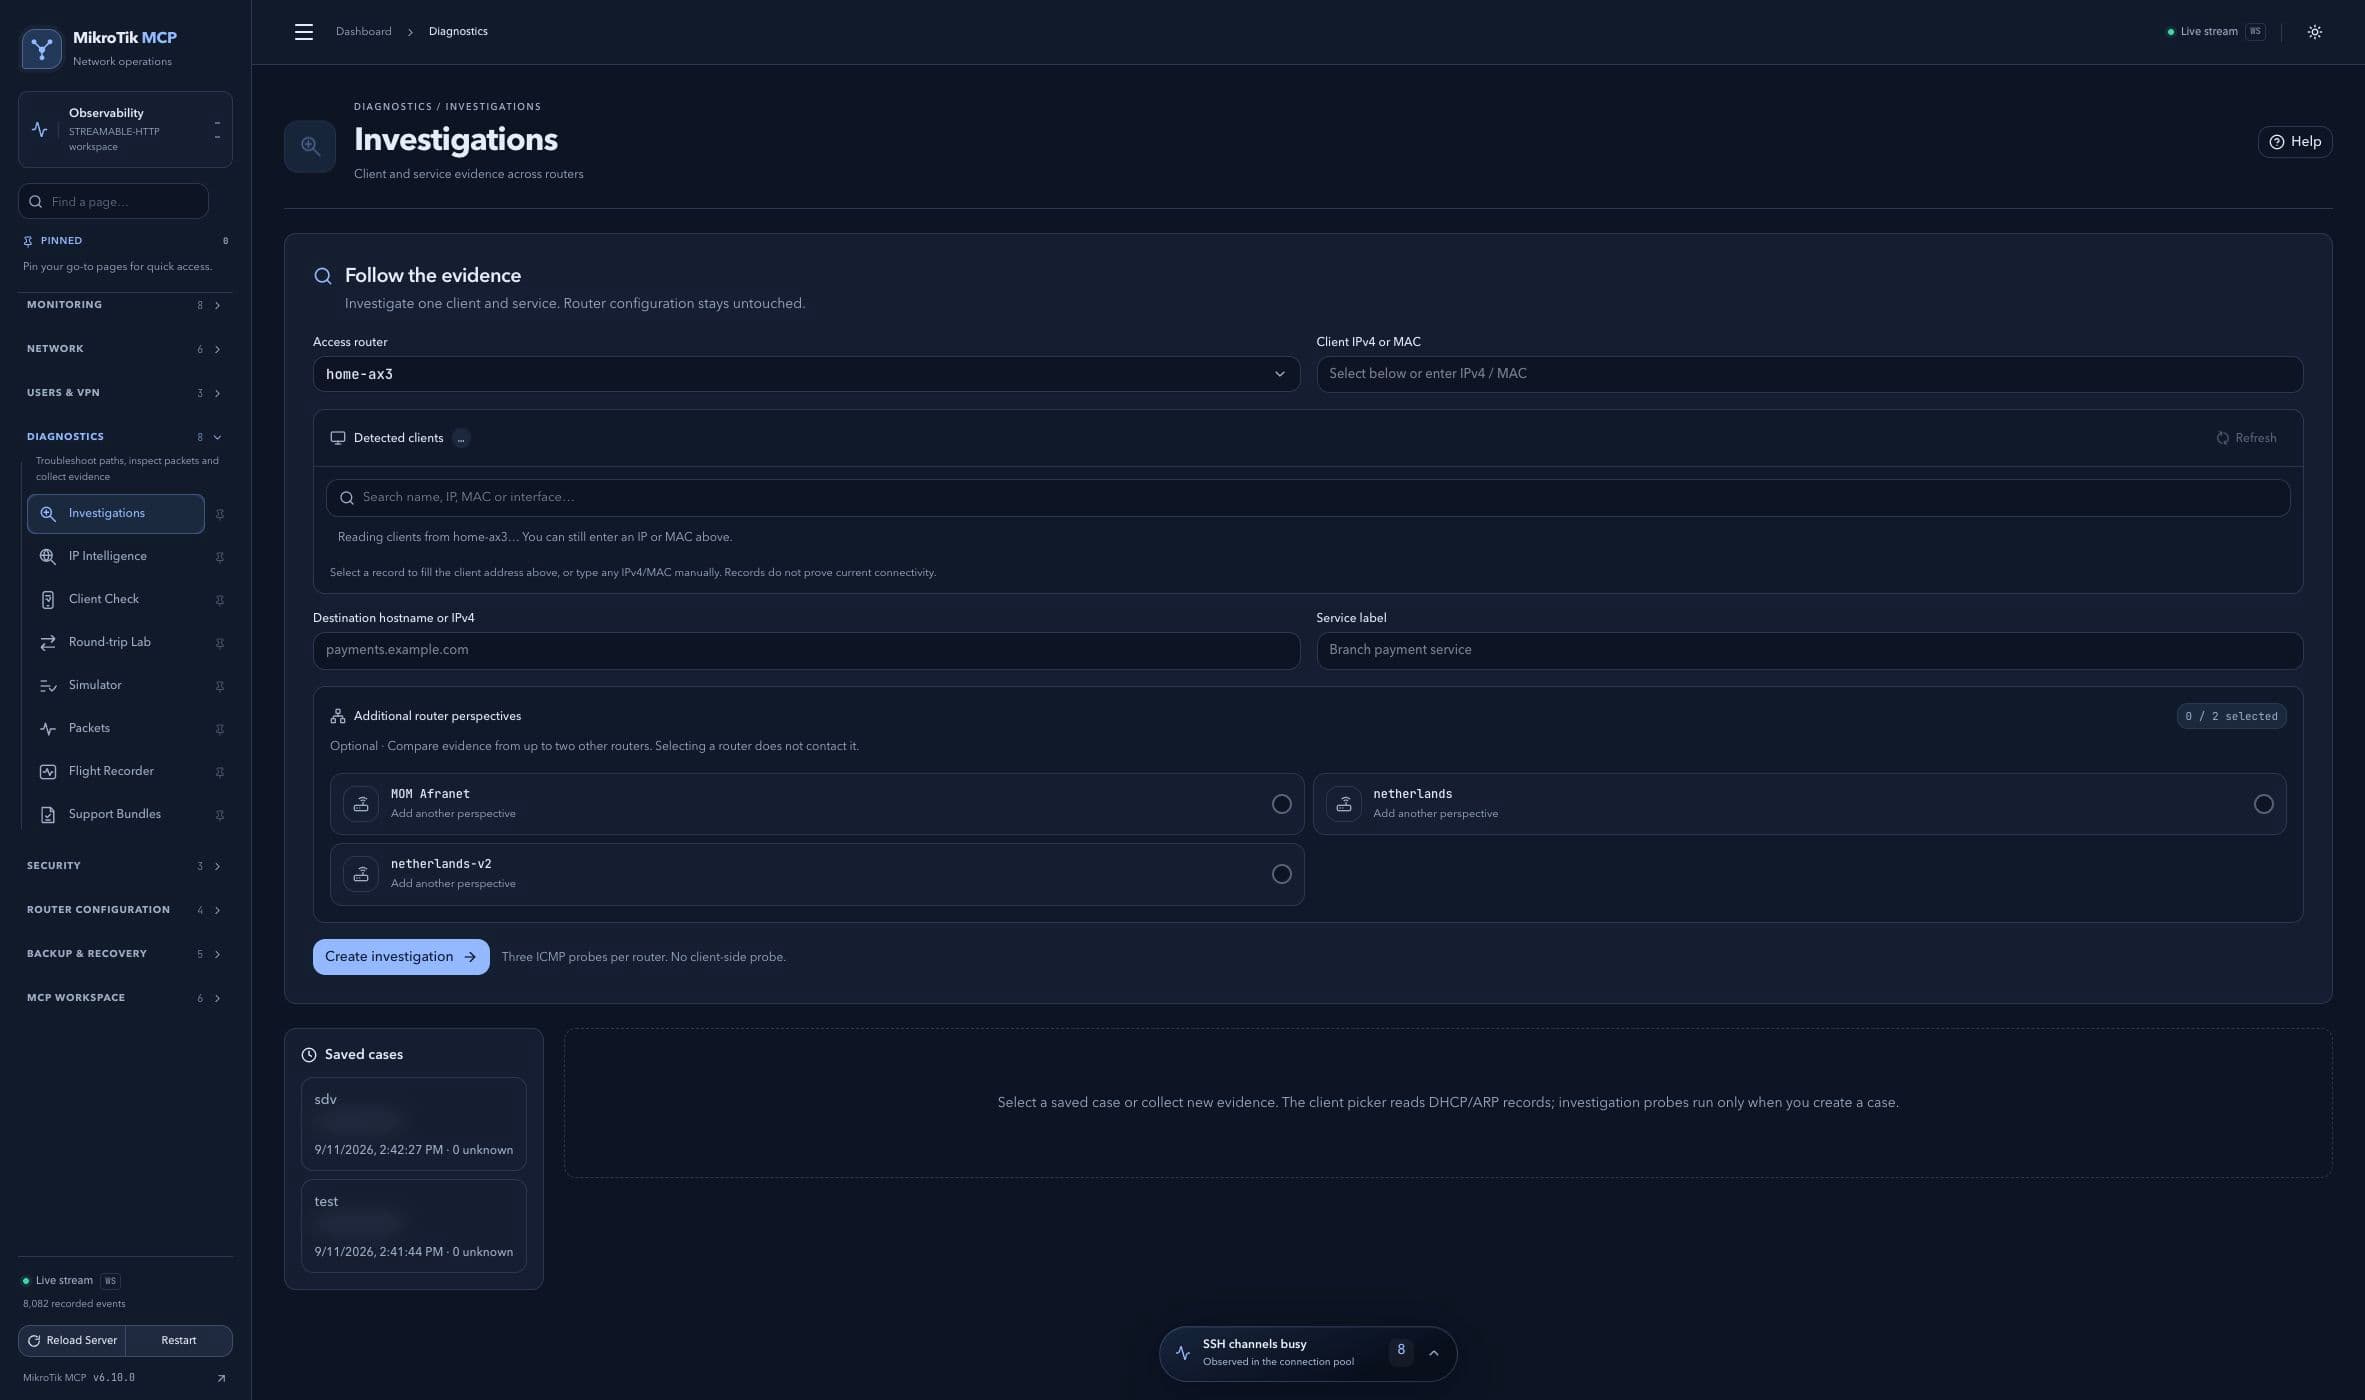 Full-page dashboard preview with IP addresses and snapshot/backup names blurredFull page · Click to enlarge ↗
IP addresses, snapshot/backup names and AAA/OpenVPN usernames are blurred in this full-page capture.