
Read the MCP's activity
Open Monitoring → Overview (#overview). Select the time window to inspect tool activity recorded by this MCP server.
The summary includes total calls, calls per minute, error rate, average/p95/p99 latency, distinct tools and output volume. Latency is tool execution time, not internet ping; output volume is tool-response data, not router bandwidth.
Follow a signal
| Panel | What to use it for |
|---|---|
| Calls over time | Find bursts of MCP activity and errors. |
| By risk | Understand how many calls carried each risk annotation. |
| Top tools | Compare call counts, p95 duration and errors by tool. |
| Status | Compare recorded successful and failed calls. |
| By device | Identify which routers received tool activity. |
| Recent errors | Open a recorded call's detail to inspect the failure. |
A risk annotation describes the operation's category; it is not proof of an attack or an approval record. Low activity does not prove the network is healthy, and a tool timeout does not alone prove a router or tunnel outage.
Use Live Feed for individual calls and Devices for management connectivity. Recording and retention are configured separately; see observability.
Screen preview
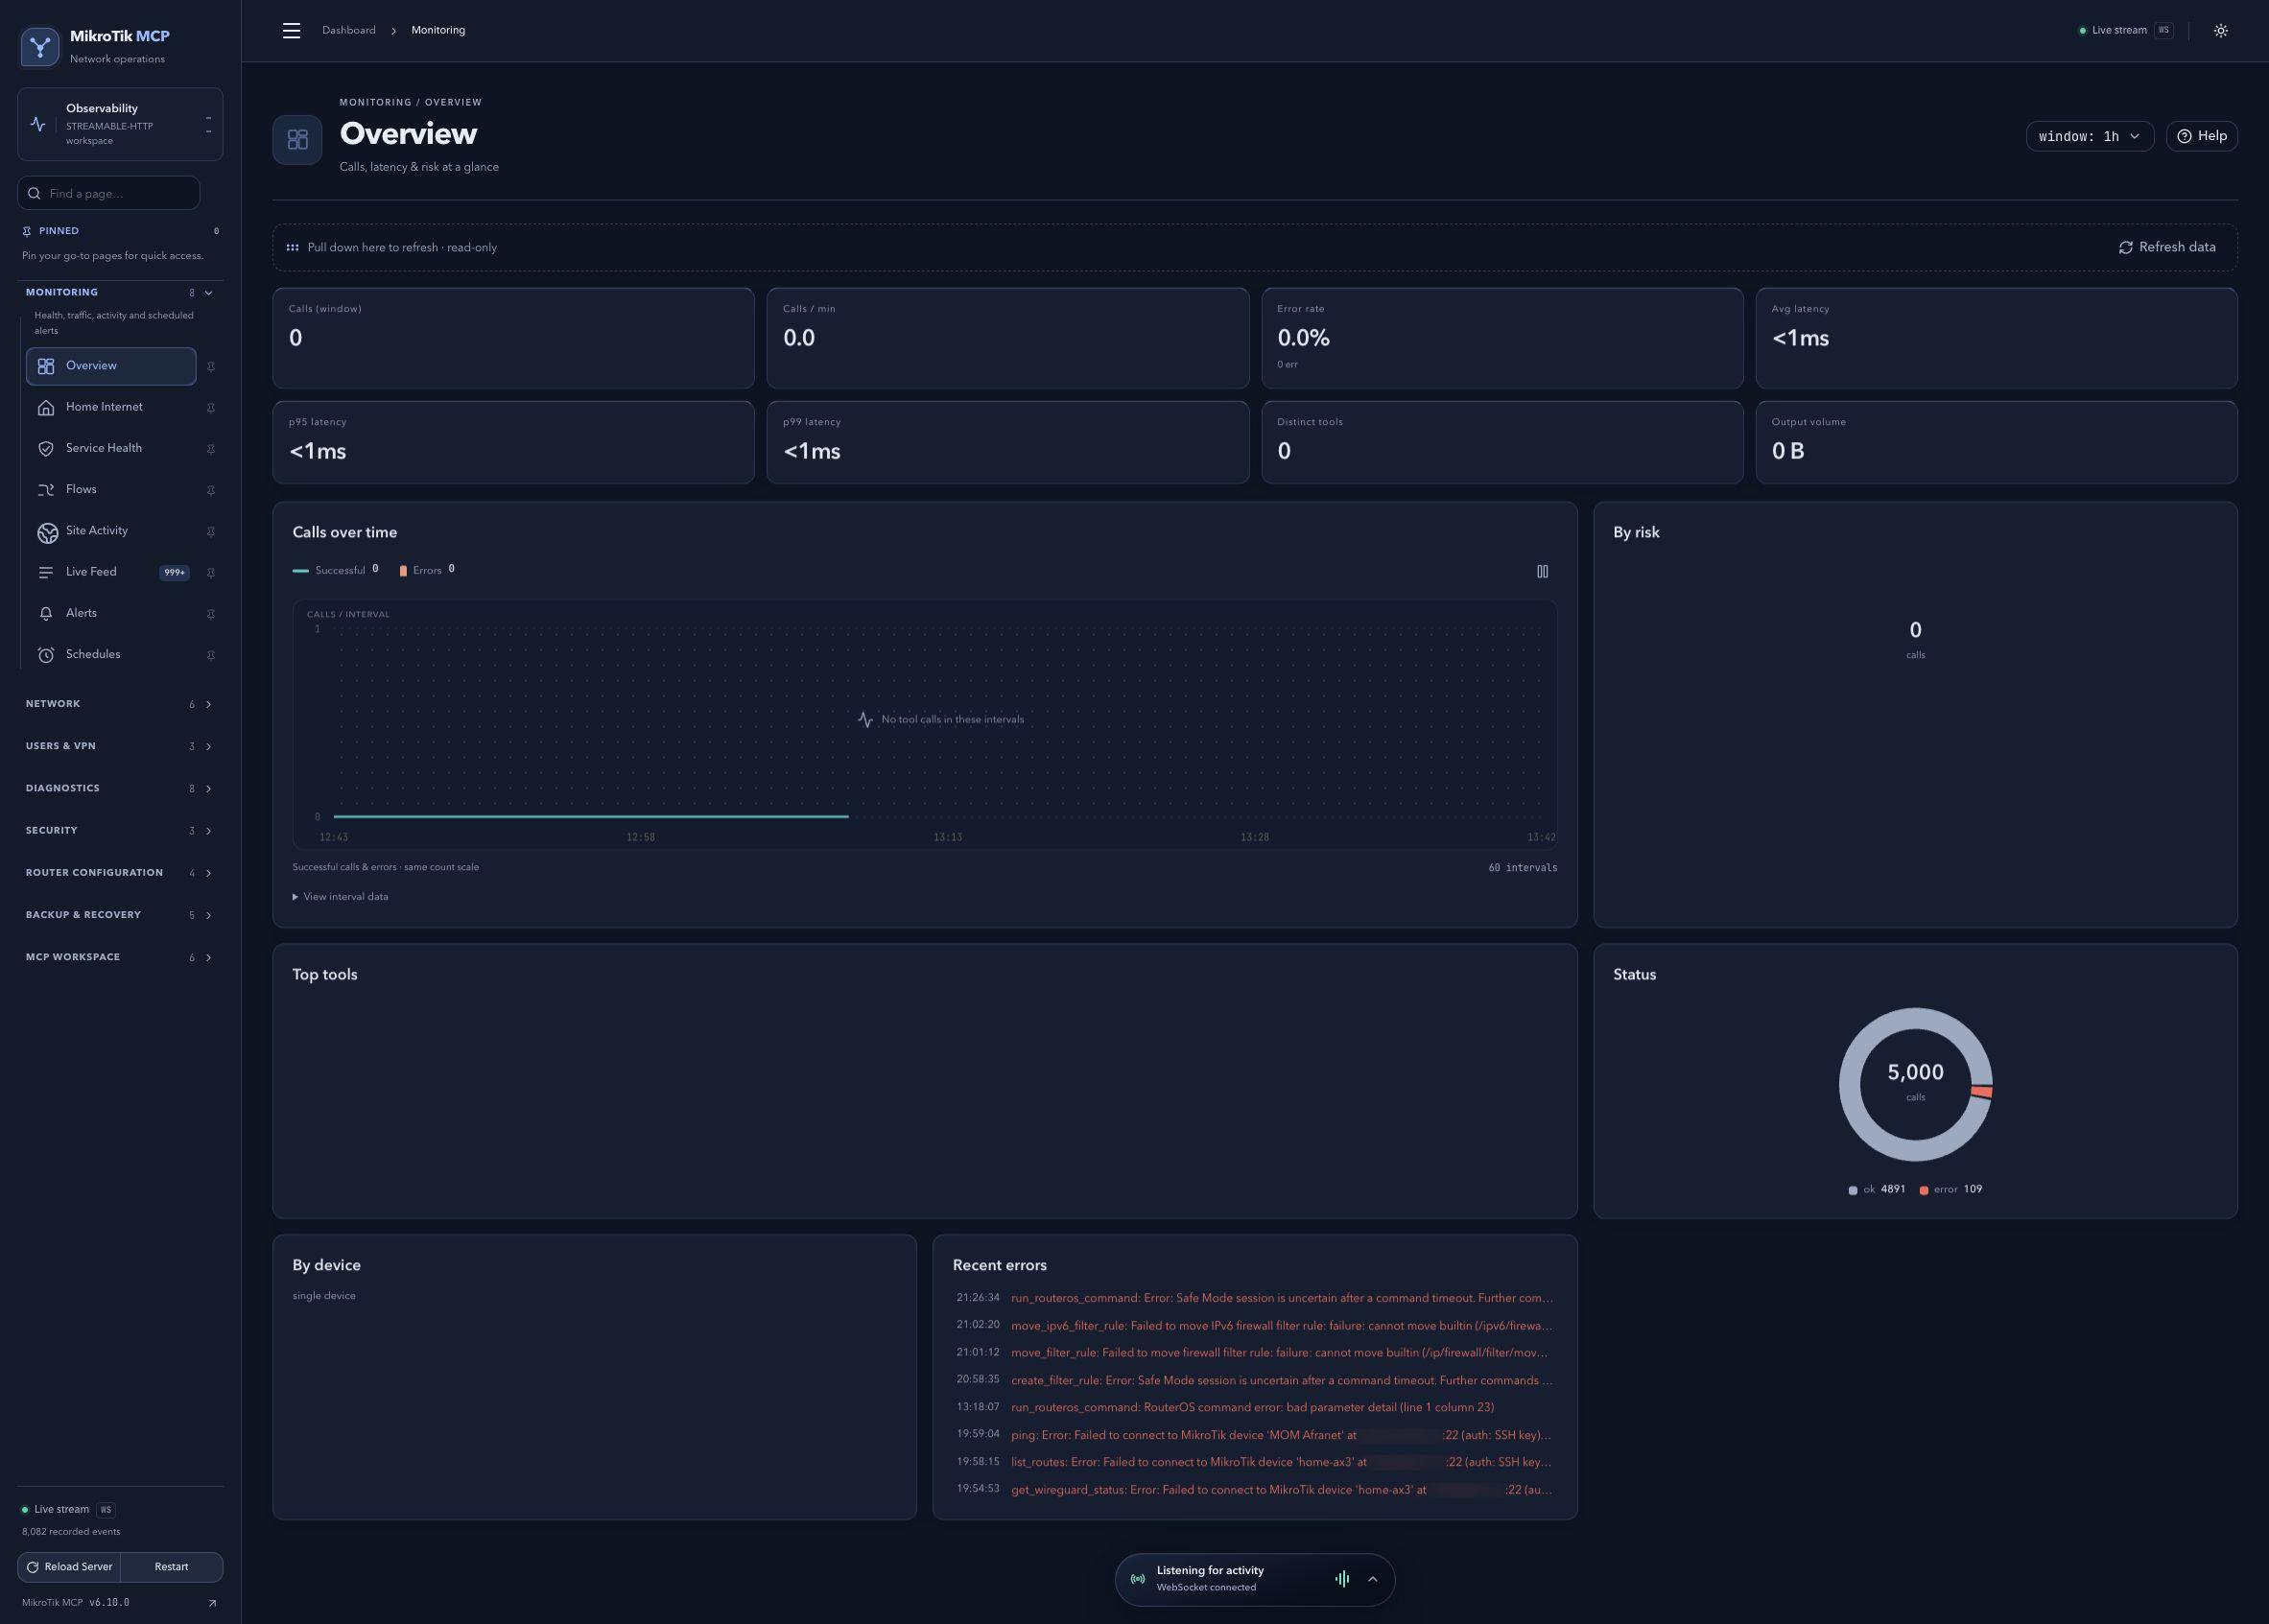 Full-page dashboard preview with IP addresses and snapshot/backup names blurredFull page · Click to enlarge ↗
IP addresses, snapshot/backup names and AAA/OpenVPN usernames are blurred in this full-page capture.