
Inspect a port or tunnel
Open Network → Interfaces (#interfaces) and choose an enabled router. Select an interface card to inspect its detailed traffic chart and counters.
Search by name, type, MAC or comment; combine the search with state and interface-type filters. Show more interfaces expands the card list in batches of 24.
Read traffic correctly
| Display | Interpretation |
|---|---|
| RX / TX rate | Average received/sent bits per second between valid samples. RX enters the interface; TX leaves it. |
| Traffic chart | The last 60 samples, with gaps preserved. Two valid reads are needed for a rate. |
| RX / TX total | Cumulative router byte counters, not a selected user's session usage. |
| Packets and packets/s | Totals and sampled packet rates. |
| Errors, drops, queue drops, link downs | Router-reported counters; use trends and timing to investigate. |
| MTU, MAC and state | Current reported interface properties. |
Bridge, tunnel and physical-interface counters can overlap; do not sum them as independent traffic. A client's download direction depends on which interface you inspect.
Control monitoring
The live stream samples about every two seconds. Pause freezes this view; Resume resumes it. Hidden pages pause their stream, and Reconnect retries it explicitly.
Delayed, failed or disconnected readings are shown as unavailable. Retained chart points remain historical; “—” means missing data or a required baseline, not zero traffic. Monitoring is read-only.
See network workspaces.
Screen preview
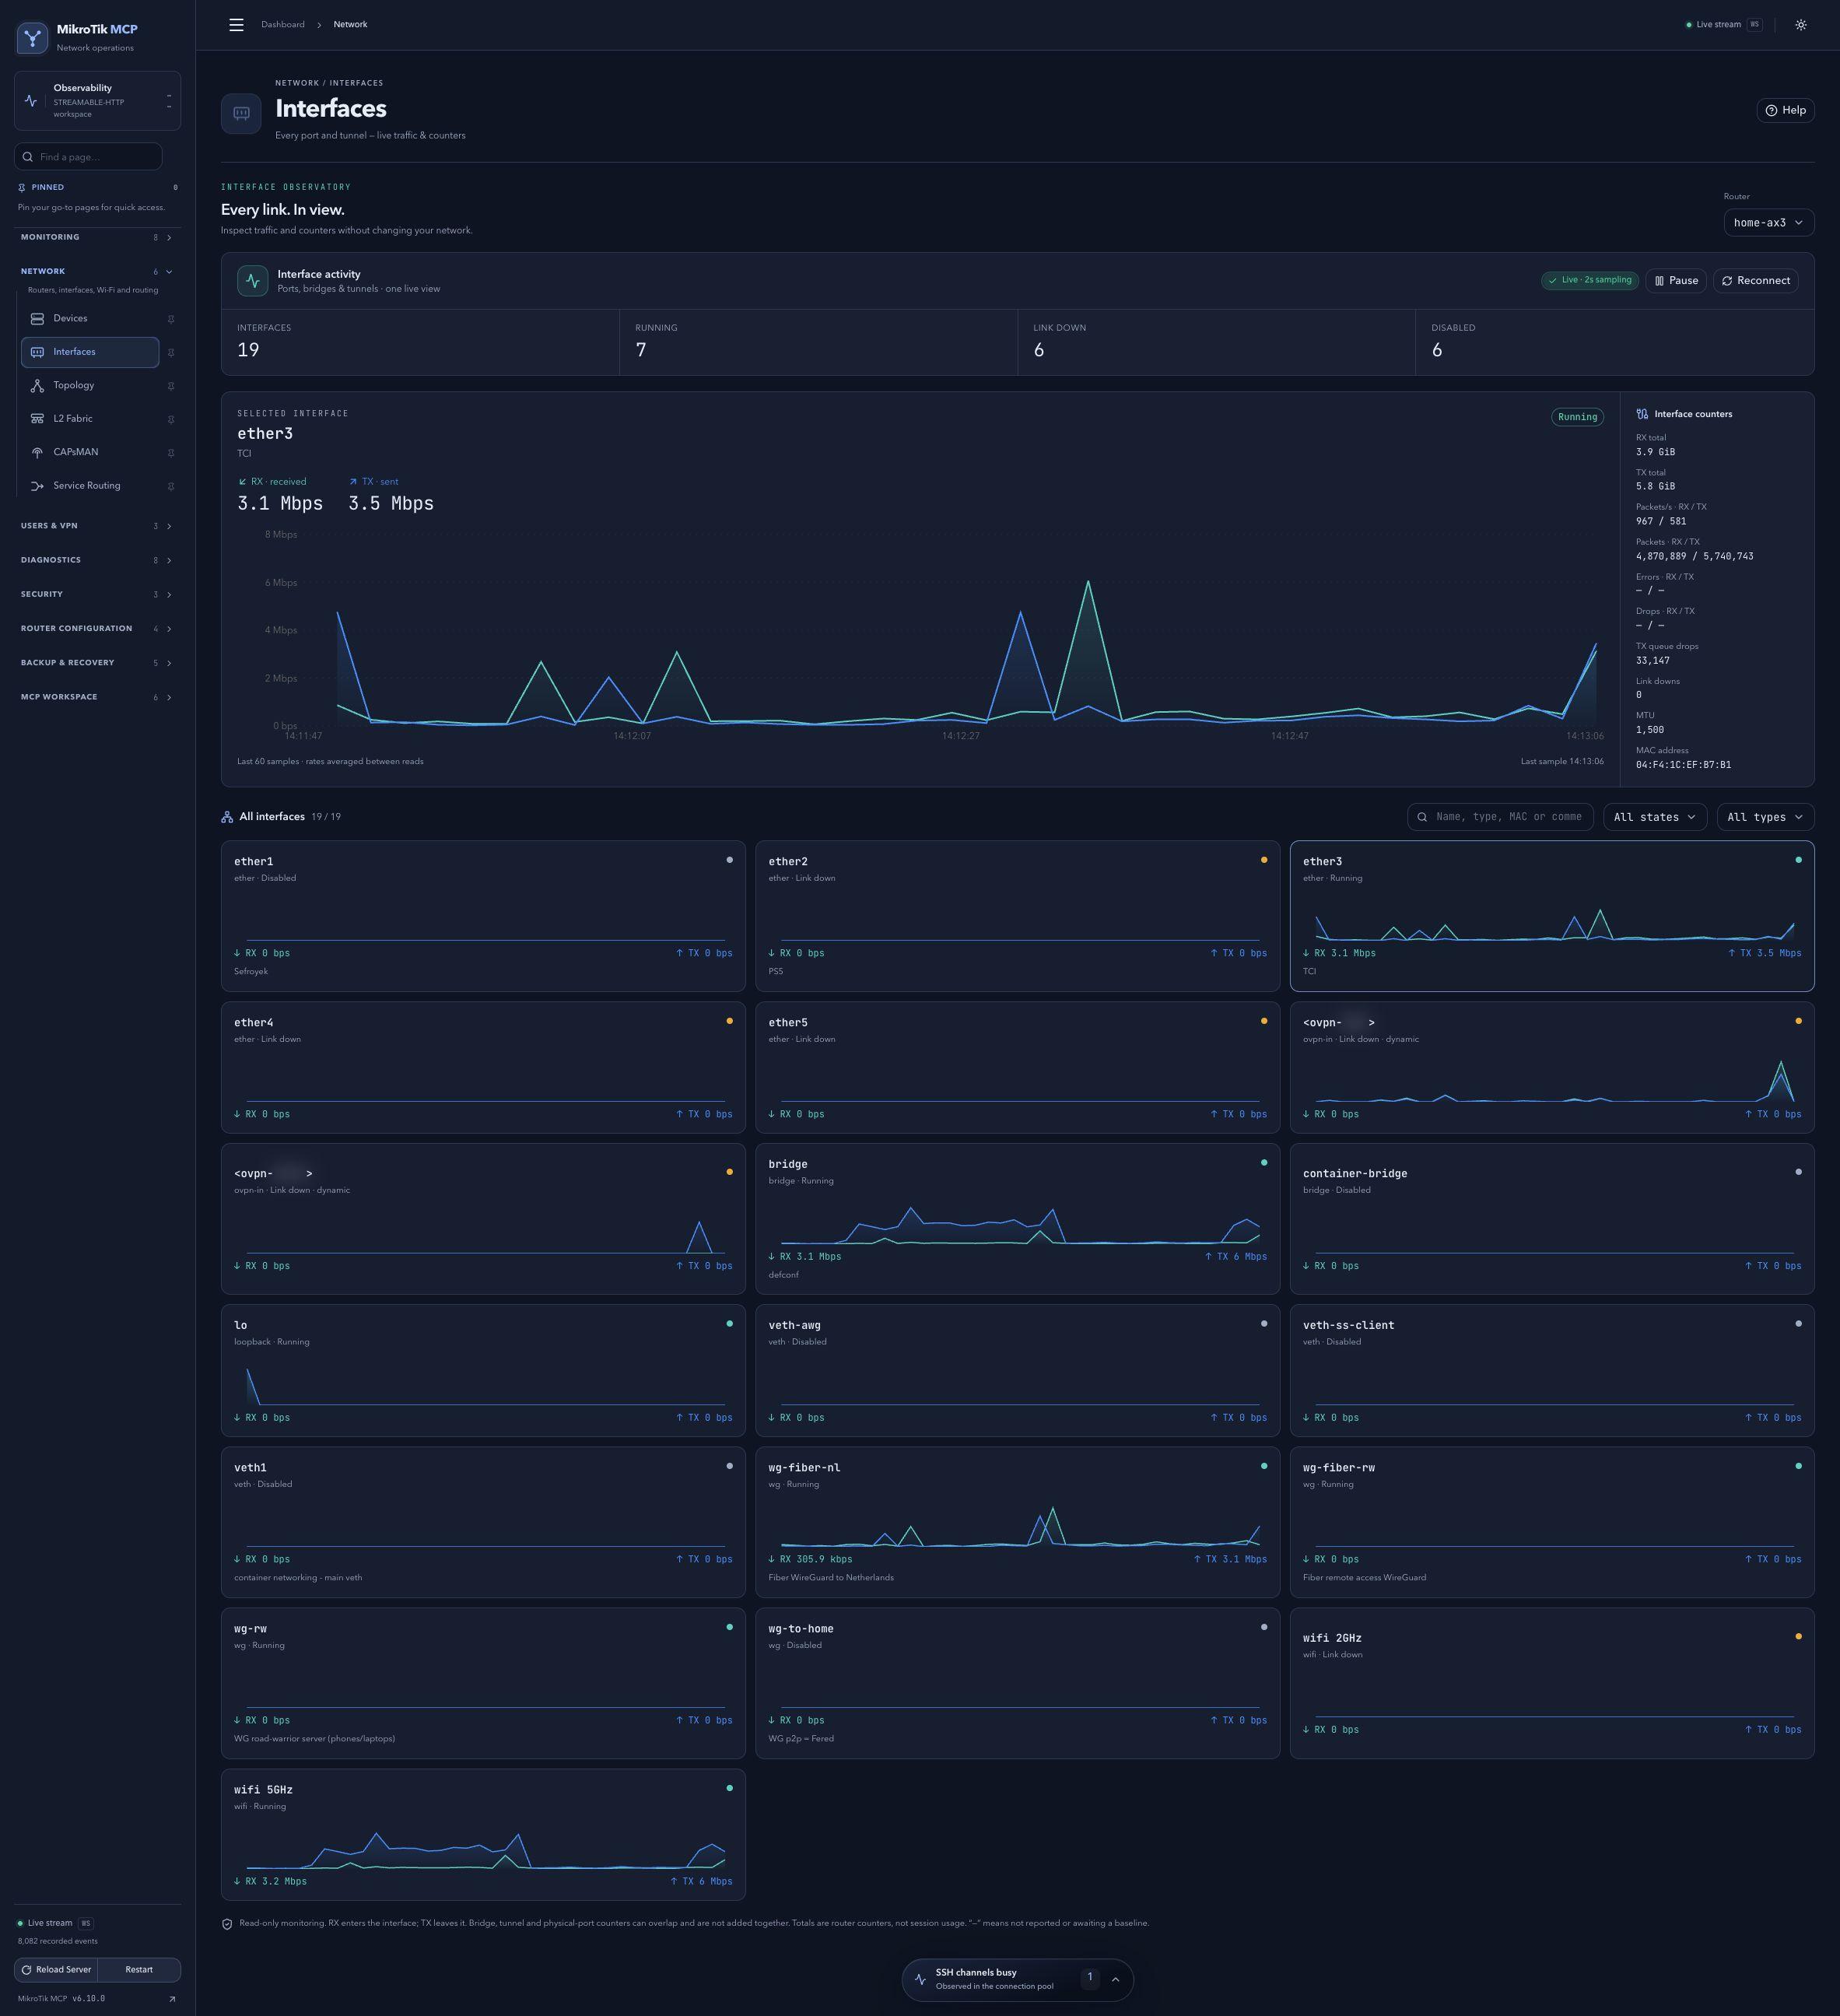 Full-page dashboard preview with IP addresses and snapshot/backup names blurredFull page · Click to enlarge ↗
IP addresses, snapshot/backup names and AAA/OpenVPN usernames are blurred in this full-page capture.