
Read exported traffic metadata
Open Monitoring → Flows (#flows). Start a local collector and configure the router's Traffic Flow target before expecting data; opening this page does not enable either. Follow Traffic Flow setup.
Explore traffic
Choose a time window and a top-talker dimension. The page refreshes every 10 seconds and shows:
- Total observed bytes, flow records, distinct sources and destinations.
- Ranked talkers and their traffic over time.
- A conversation diagram for the leading 12 pairs, plus a busiest-conversations list.
- Application labels and protocol shares.
Application names are inferred from available flow metadata; they are not a complete browsing history. For per-client observed hostnames, use Site Activity.
Check collection before interpreting a chart
The collector-health strip explains receiver/exporter status and pending templates. NetFlow v9/IPFIX needs templates to decode records; export timeouts also delay visibility. An empty window can mean missing exports, expired retention or an unreachable receiver rather than no traffic. Hardware offload and unexported paths can leave gaps.
Flow data contains addresses, ports and counters, not packet payload. Totals describe received records, not an independently measured ISP bill. See collector health for diagnosis.
Screen preview
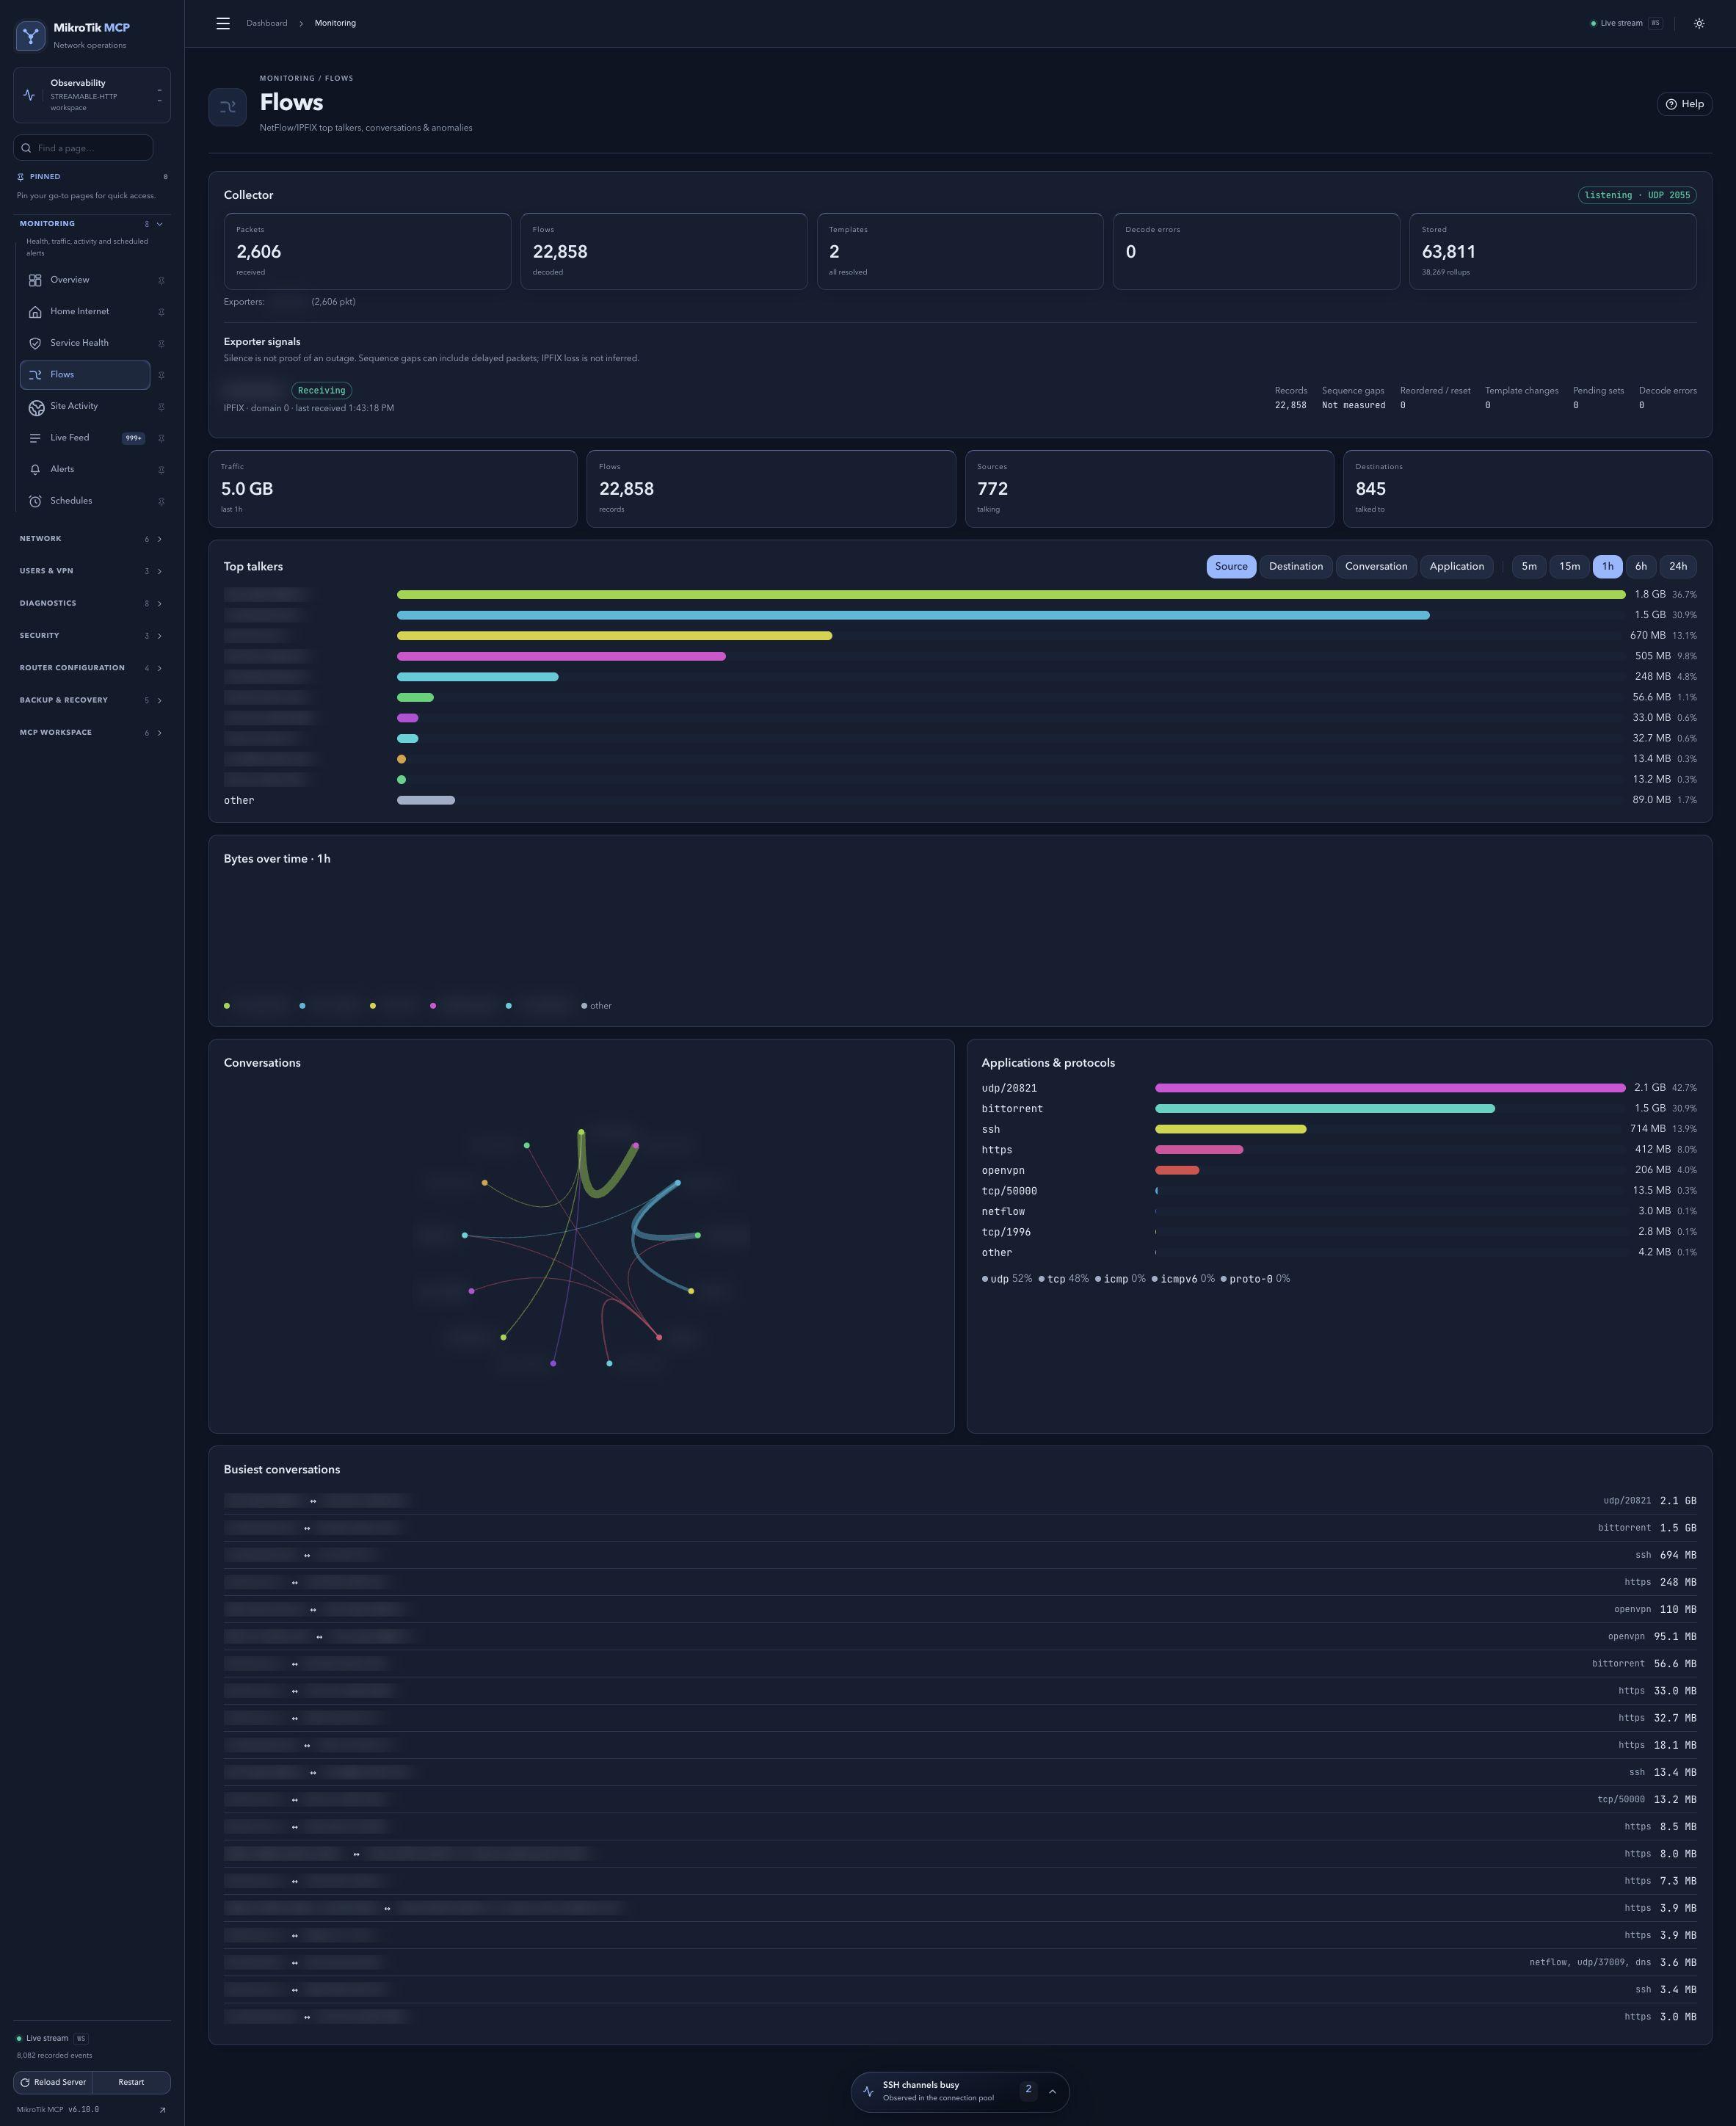 Full-page dashboard preview with IP addresses and snapshot/backup names blurredFull page · Click to enlarge ↗
IP addresses, snapshot/backup names and AAA/OpenVPN usernames are blurred in this full-page capture.